The cost effective way to debug SSD sidebands
When debugging an SSD or similar device, there are various things that can go wrong on the interface between the host and device. Here we’ll see a simple way to look at what is going wrong with the host/device interaction.
A high end protocol analyser such as the SerialTek Kodiak can let you see just about everything. The Kodiak can see the PCIe data and sidebands between your host and device. It can even capture power usage (via an integrated Quarch PAM).
Alternatively an SSD validation tester such as the SANBlaze DT5 can test the device side in a great deal of detail.
This grade of equipment is not going to be available on every engineers desk though. When testing new SSD designs, especially when testing against multiple hosts, it can be very useful to have a simple insight into what is happening.
This is where the PAM (Power Analysis Module) from Quarch comes in. Its proven across the storage industry and very simple to deploy.
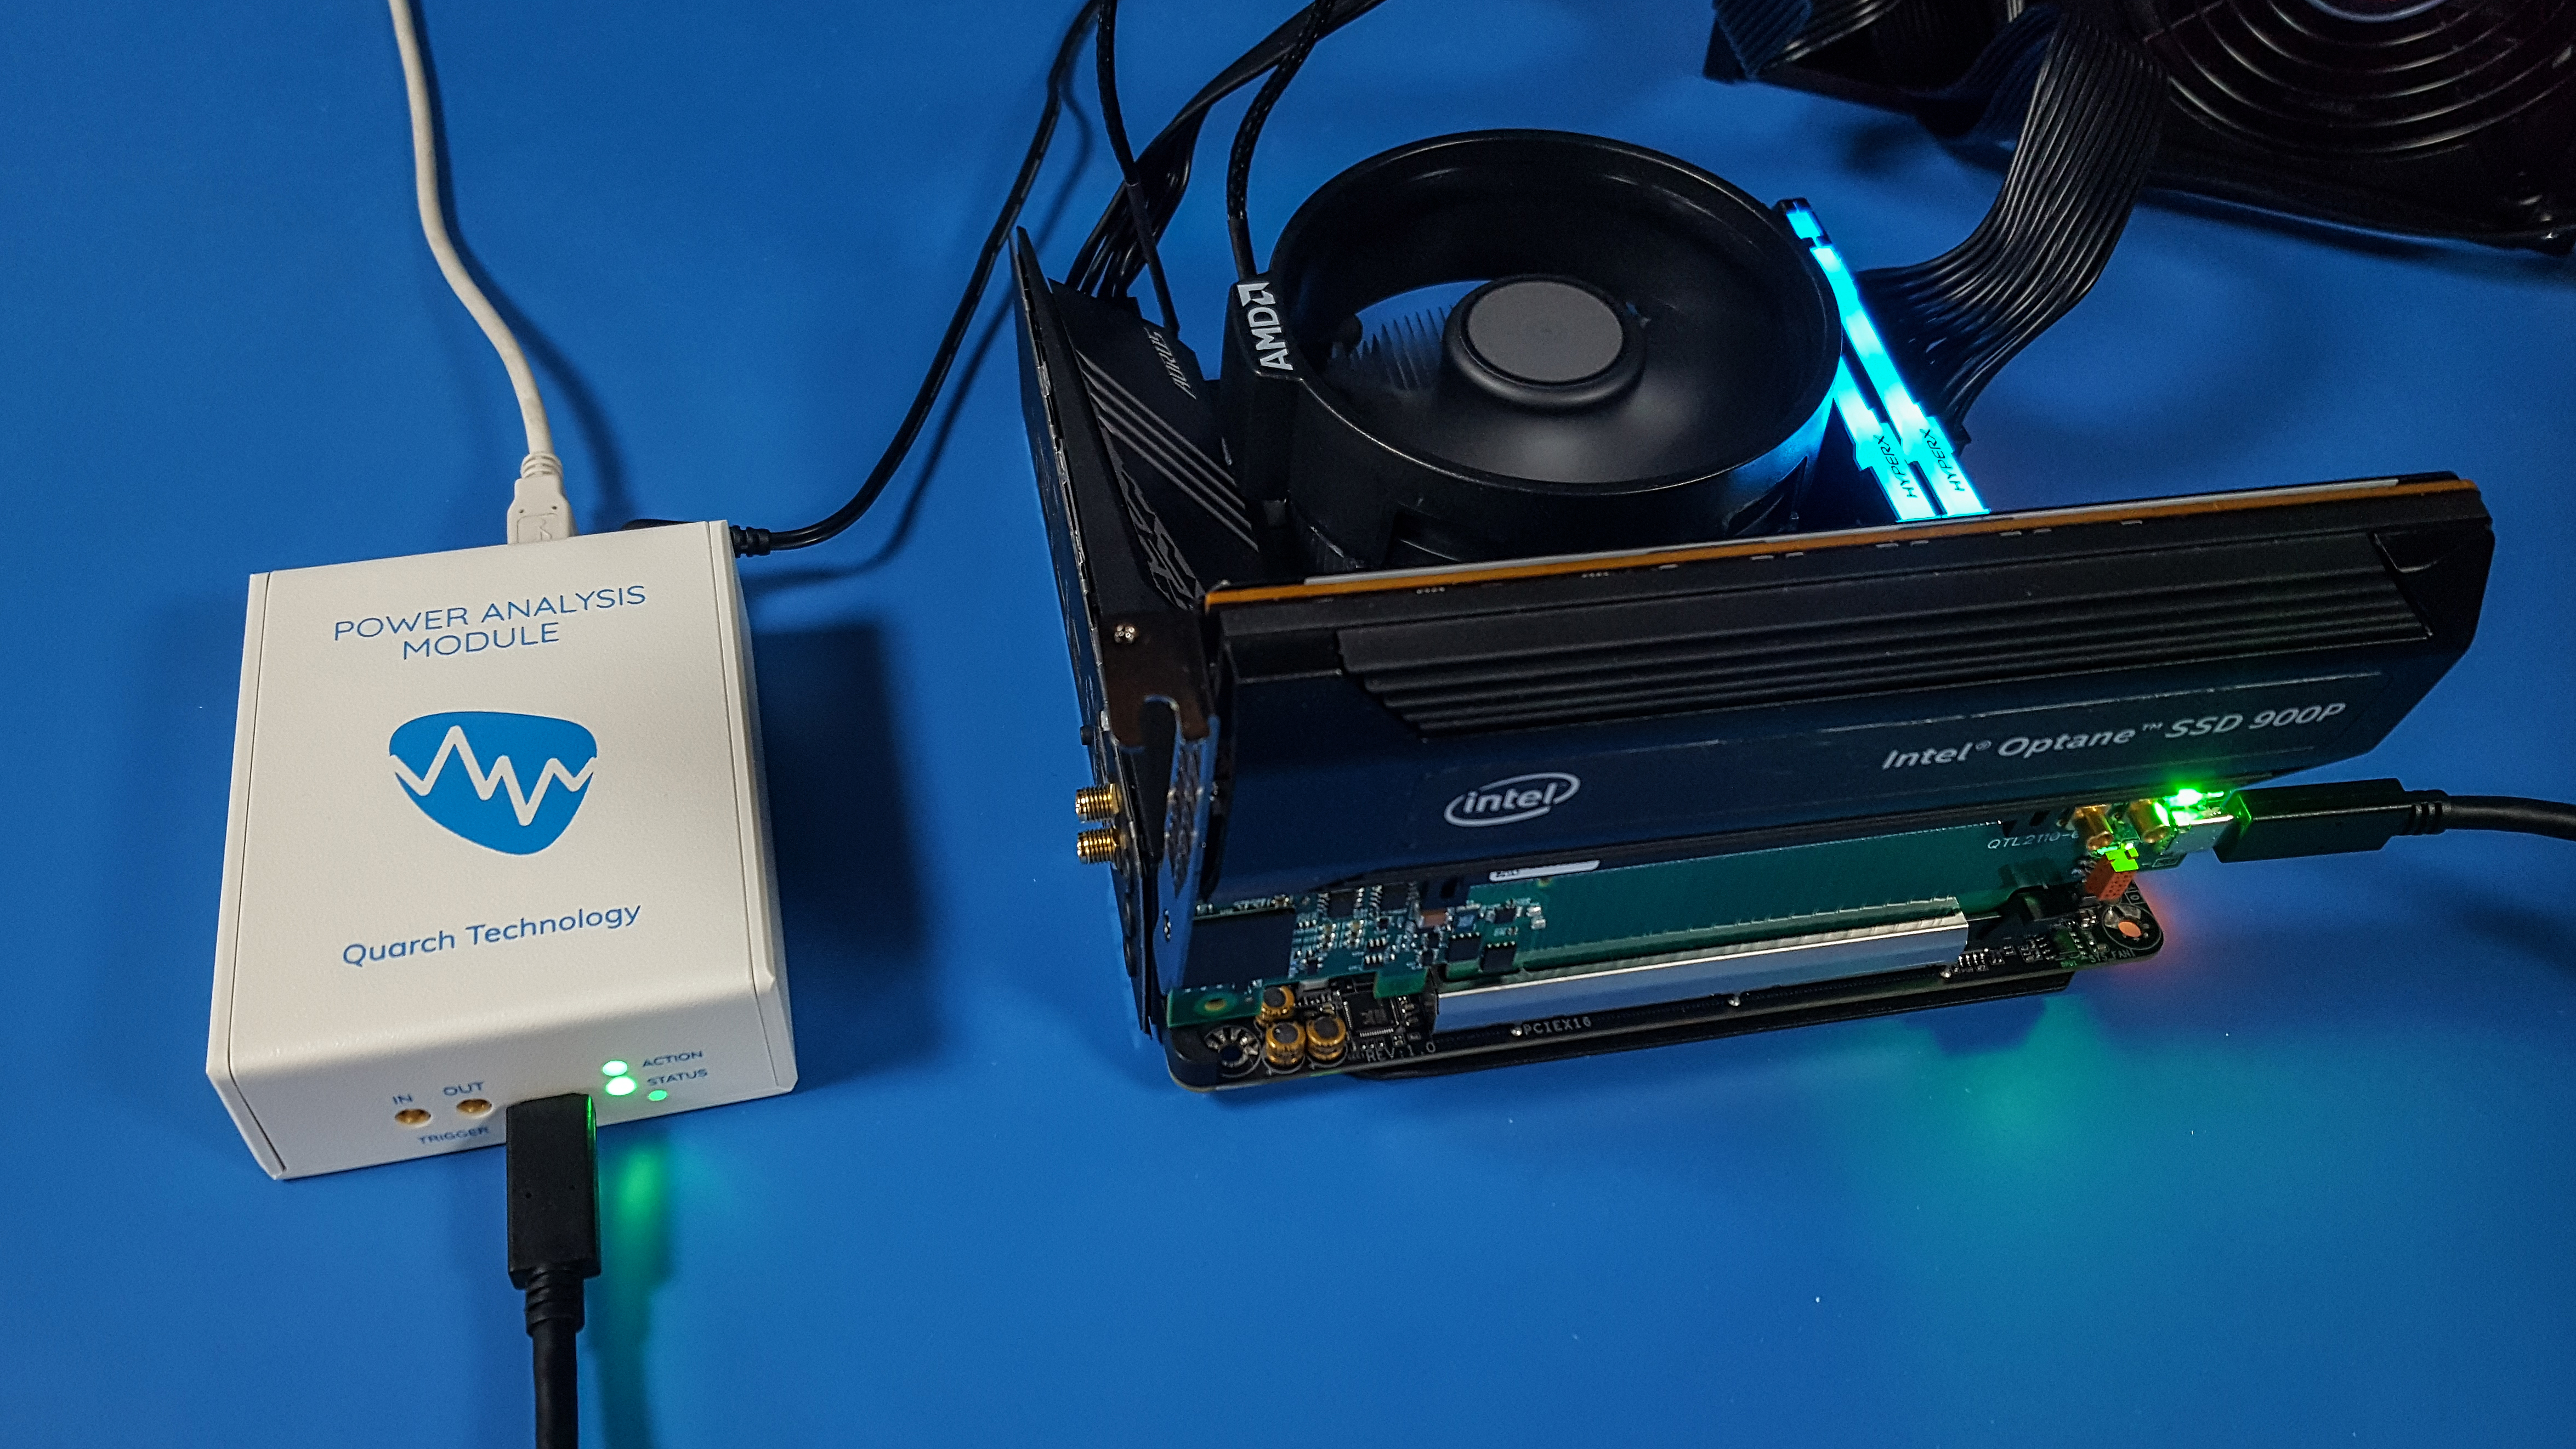
The PAM is small, simple to use and a very cost effective way to analyse a device. It has several key features:
-
-
-
Calibrated voltage/current/power measurements
Measurements are sampled every 4uS (250 thousand times a second) to give an accurate and detailed view of peak and average energy use. You can also see host voltage rail performance (ramp rates and stability). -
Sideband capture
These are sampled every 1uS (1 million times a second) and allow a detailed view into assertion timing. This is the feature we will be looking at in detail -
Power control
The power rails can be switched, allowing the device to be cycled on and off for testing. This is not a ‘full’ hot-plug simulation as our Breaker range can perform, but it is still very useful, especially for automated testing.
-
-
Here is a power up capture of an SSD, we captured. This was captured at 16uS sampling (so 4x 4uS samples are averaged into a single value). This reduces the data stored while maintaining very accurate power consumption.
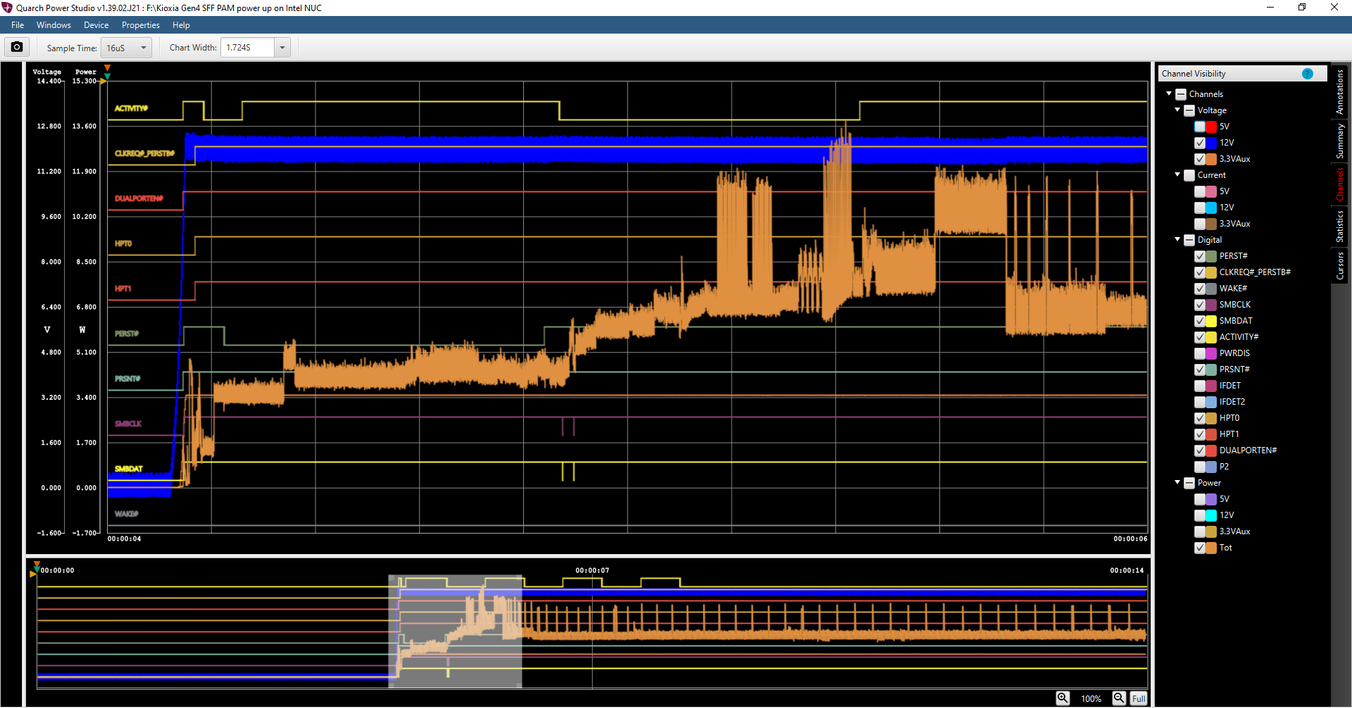
We can see various interesting things in this trace:
-
-
-
The rise times and sequencing of the 12v and 3v3 rails
-
The power profile during enumeration, and the 6.18 watts idle power after the drive has started
-
The regular 2mS spikes up to 10 watts
-
Dualport# signal is high, indicating a single-port device
-
The PERST assertion timing in relation to the other signals
-
The SMBUS activity
-
The Activity/LED signal alternating high and low
-
-
This was a ‘good’ power cycle, where the device enumerated correctly. Here are a couple of unusual examples:
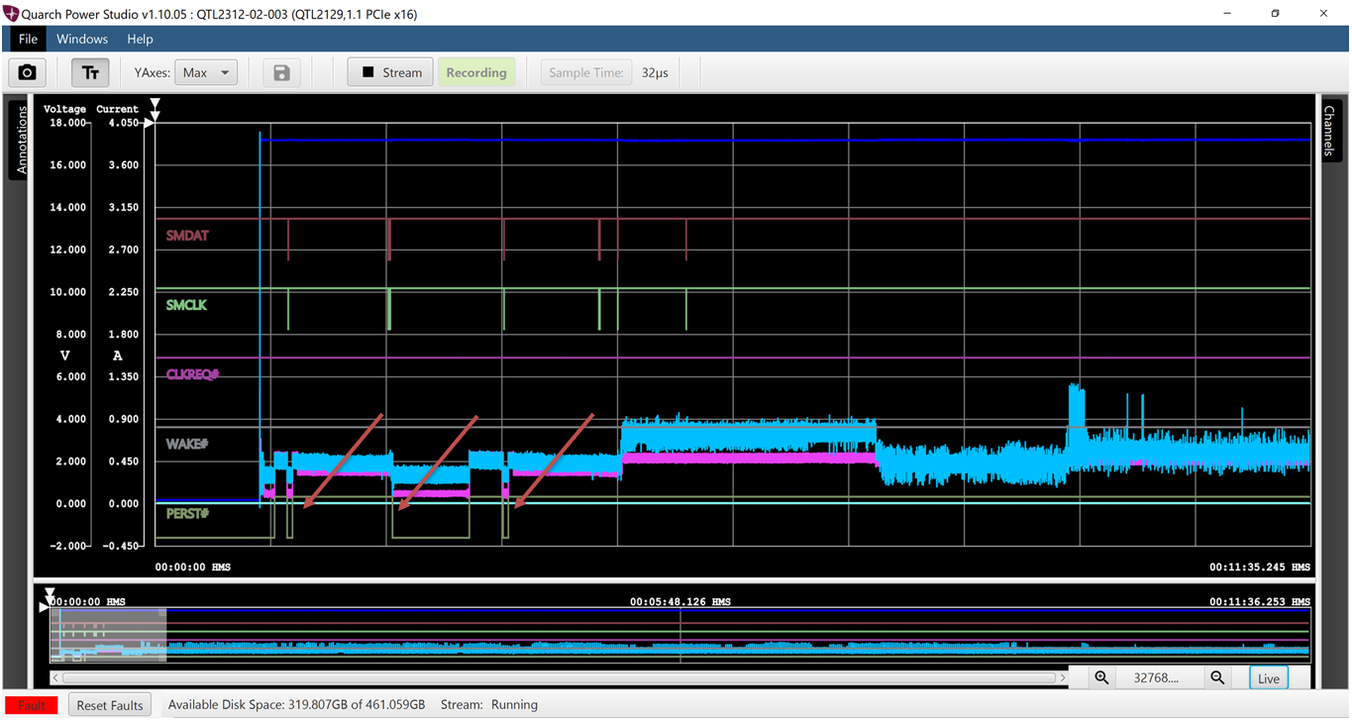
Here we can see multiple PERST assertions. This enumeration did work, but multiple/unusual PERST assertion can be a sign of a problem. With the PAM, you can measure the exact timings and verify if they meet the spec. You can even use the pin-bounce feature of our Breaker modules to recreate a timing sequence
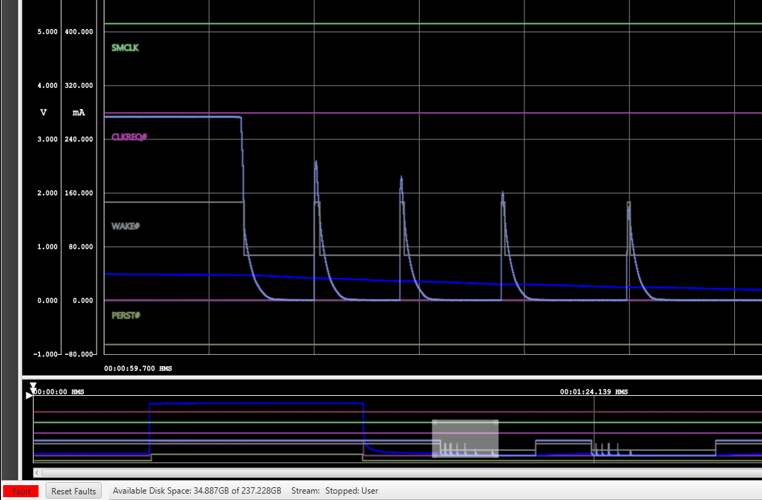
In this example, AC power was pulled from a PC. The SSD trace region above shows the shutdown of the 3v3 rail. The rail voltage drops to 0, but then ‘chirps’ back up briefly several times.
It is likely that the PSU does not ‘realise’ it has lost external AC power and is trying to recover. Each time it does, the WAKE# signal changes state.
If an SSD is busy trying to save data during a power loss event, the sudden change in state of the WAKE signal could confuse the process.
Next steps
Contact Quarch or one of our local resellers today and request an evaluation unit, or just a quick chat with one of our engineers if you have technical questions.

Andy Norrie