Can your power analyser zoom to details like this?
Quarch Power Studio is a uniquely powerful capture tool for power analysis. From an hour-long overview, we can still zoom in to the smallest detail. Nothing else comes close! Check out what you are missing here.
You may have seen from our previous blogs, like Dishwasher Eco mode, we can capture power data for extended periods of time. But as always, the details are key.
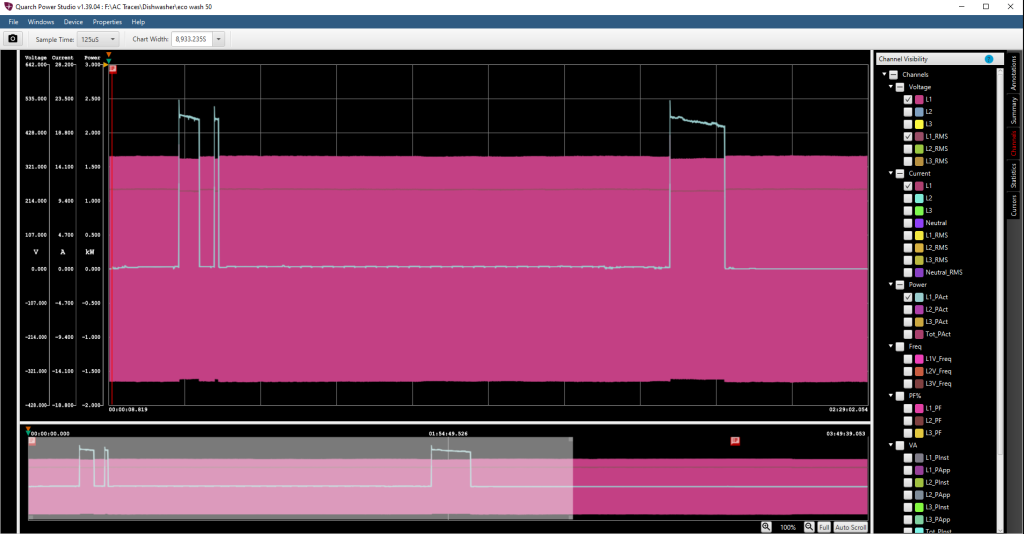
Here is the trace in Quarch Power Studio (QPS). There are about 30 channels we can view, but enabled now is just AC voltage, RMS voltage and power.
We get a nice overview: The full trace at 3 hours and 49 minutes is visible in the ‘timeline’ at the bottom, and a large section is in the main trace window.
The large spikes in power are due to the water heating element activating. There is a small drop in voltage, expected due to the large current draw.
What’s going on in the middle, though? Let’s zoom in:
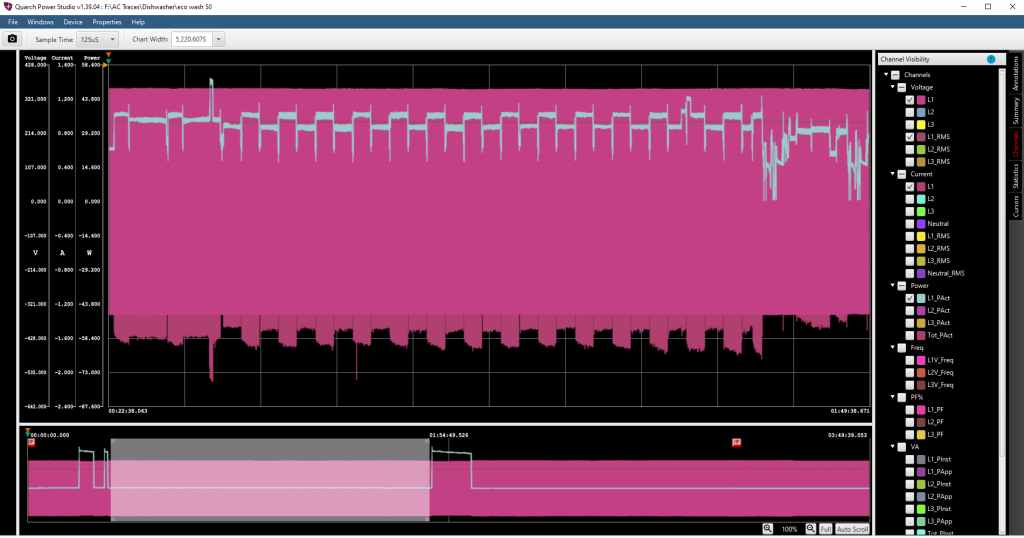
Now you can see the oscillating power usage, running in sections about 2 minutes in length as various pump cycles are running. The cycle also changes towards the end of this section, just before the heating elements are turned on again. We can go further, though:
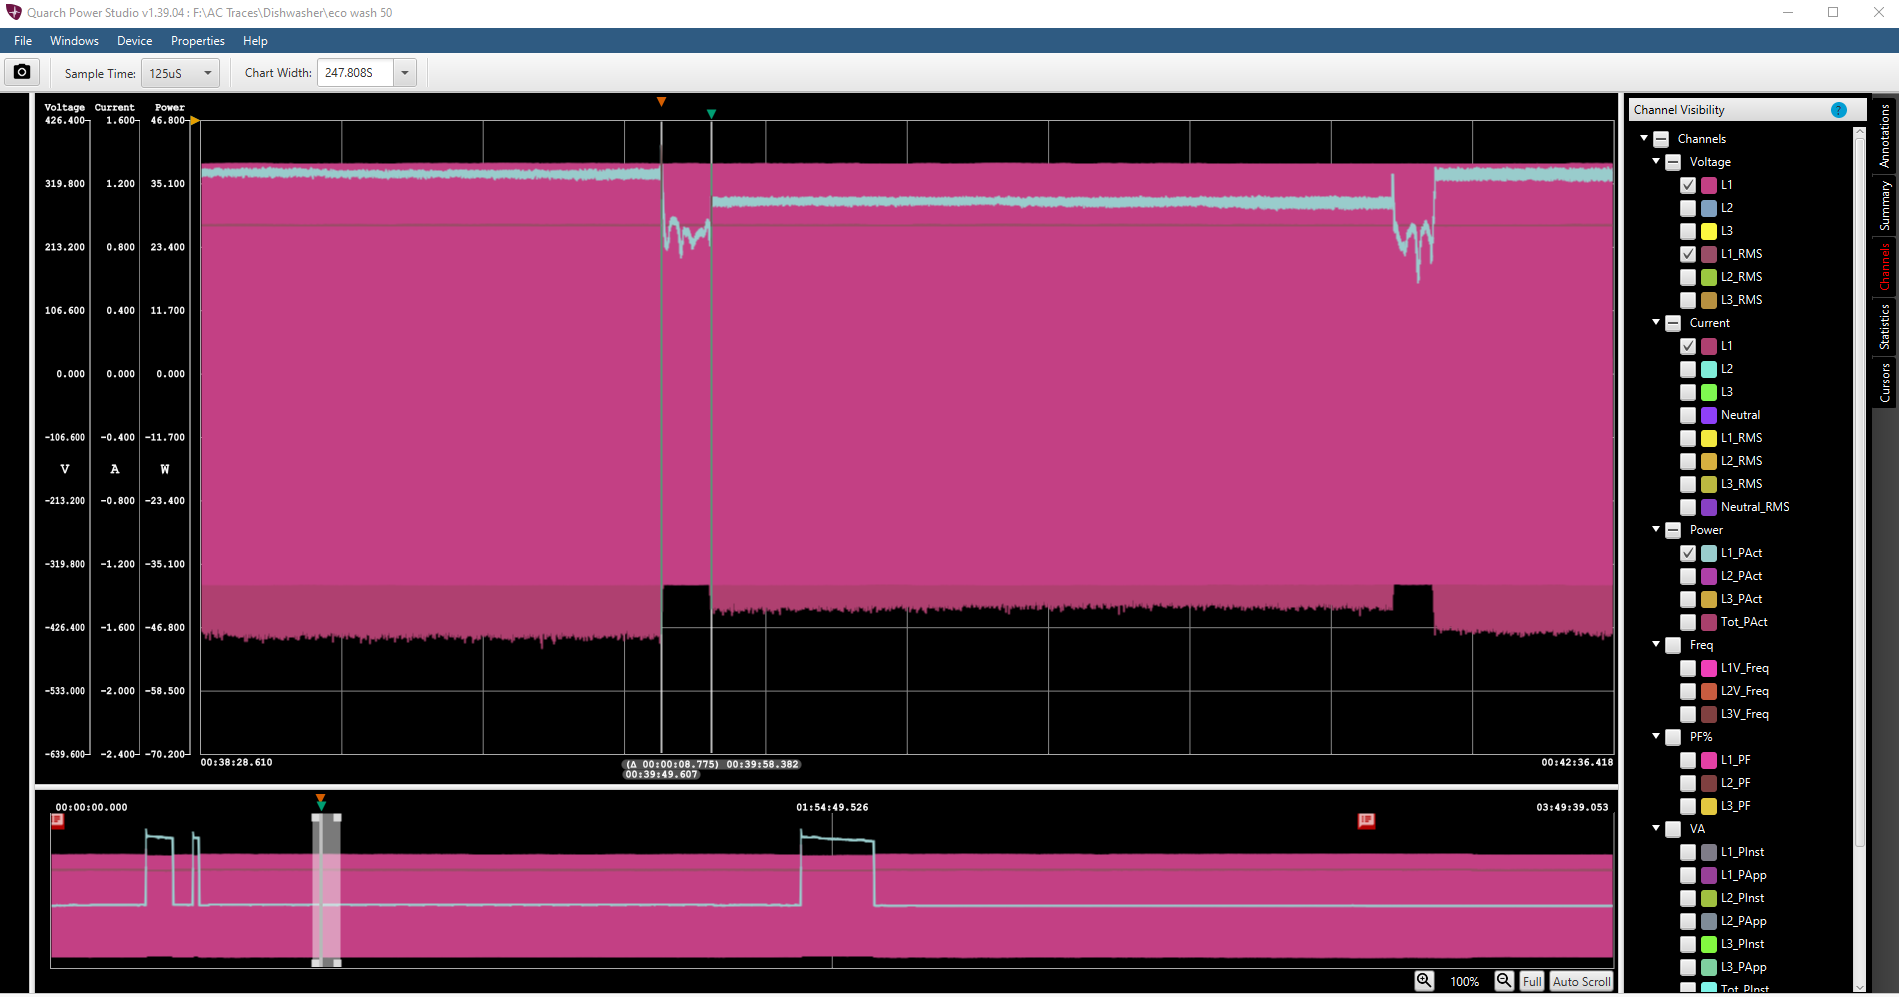
Between each 2-minute cycle, there is around 8 seconds of lower power consumption.
Can we go further?
We’re capturing at 8000 samples per second, so yes!
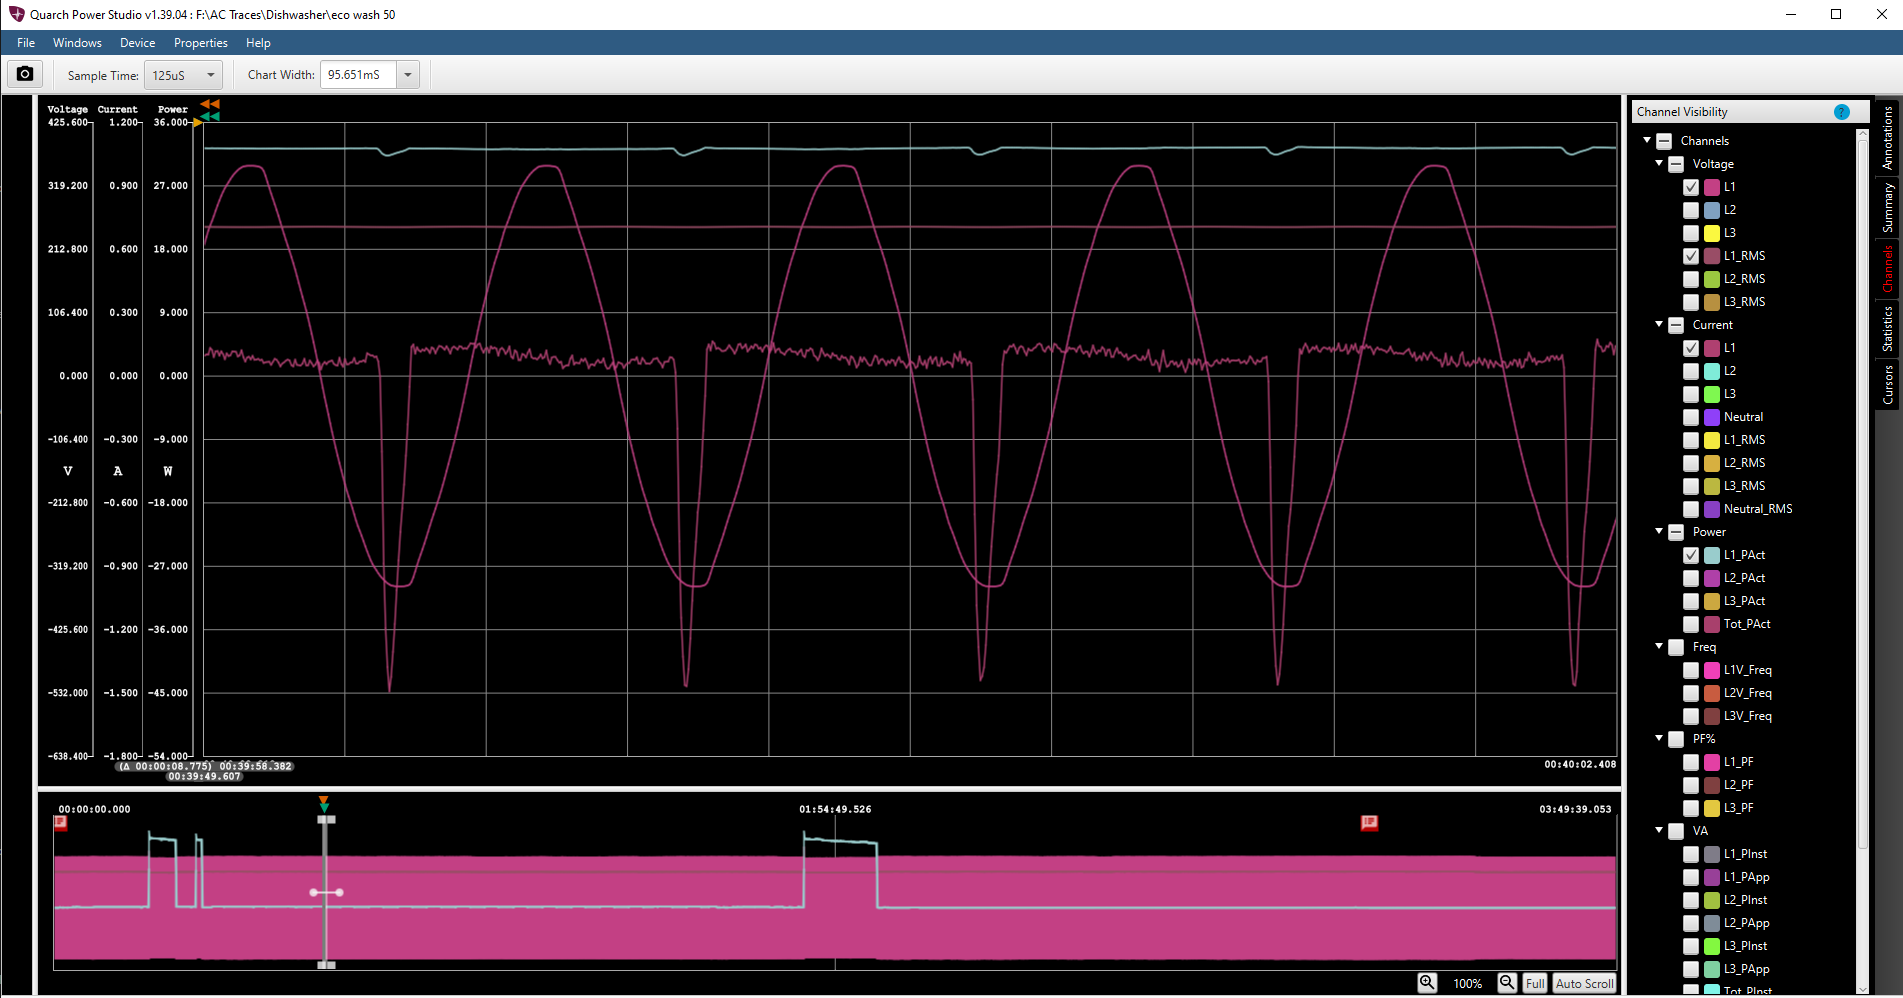
AC voltage cycles, and the corresponding current. Here you can see the rather nasty effects of the regulator circuits, which clearly do not have power factor correction.
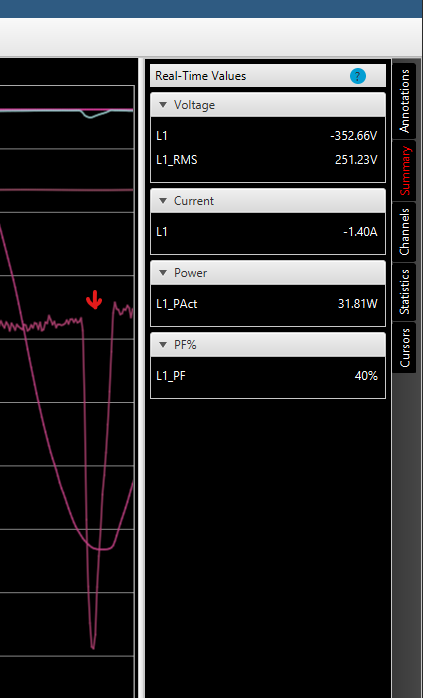 If we turn on the power factor channel and pull up the summary values here with the cursor here, we see a factor of 40% (0.4), when 1 is ideal. This is due to the big current spike on the negative side of the AC cycle, and nothing on the positive.
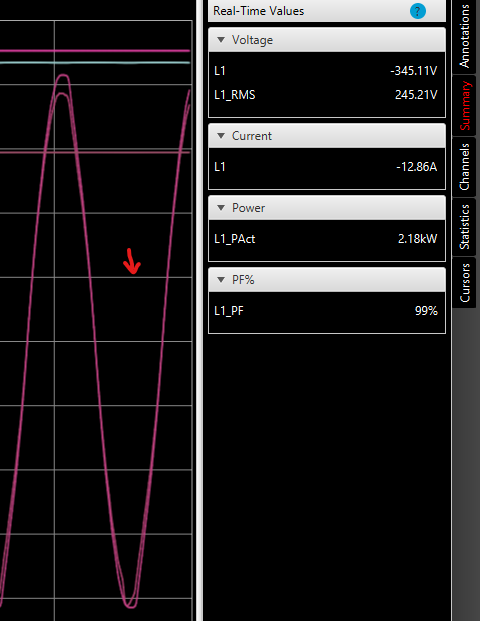
If we do the same on a part of the trace where the resistive heating element is the main consumer of energy, we get a 99% (0.99) power factor due to the clean current waveform that neatly matches the phase of the voltage.
When capturing power data, you often don’t know what you are going to see or exactly what will turn out to be interesting. The key benefit of Quarch tools is that you have a high-level overview and detailed analysis all together.
Check out our products and contact us today if you’d like to evaluate. We offer free loan units, technical training and support to get you started quickly.
Contact your local reseller or email support@quarch.com to get started!
Posted: 26th April 2024

Andy Norrie