We wanted to do a comparison with several drives we had in our labs to see what the differences were between them. Our tests reveal which enterprise-grade drive outperforms the rest.
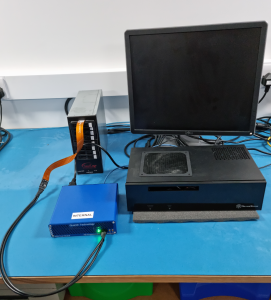
All enterprise-[grade drives were set up on one of our standard test stations. These are small form factor PC’s, using good quality consumer components. We use SerialCables host cards, cables, and JBOD for a simple, flexible setup.
- Intel I7-8700 CPU with 16GB Ram on a ROG STRIX Z390-I motherboard
- Windows Server 2016
- SerialCables Gen4 Host Card (PCI-AD-x16HE-BG4)
- SerialCables 8 Bay JBOD
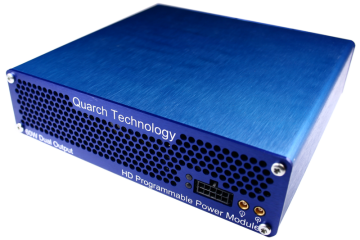
- Quarch HD PPM for power measurement
- A separate PC is used to run the QCS client and power capture, so there is no additional load on the CPU of the test PC
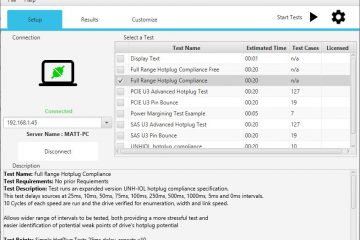
- Quarch Compliance Suite
The drives
We chose some very different drives for the test:
-
TOSHIBA PX02SM SAS3 SFF SSD 400GB
-
INTEL SSDPED1D280GA Optane PCIe Gen3 x16 AIC SSD 280GB
-
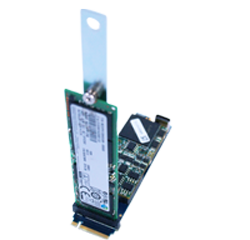
SAMSUNG MZWLJ7T6HALA Gen4 PCIe U.2 SSD 8TB
The Toshiba SSD was connected directly to the host via SATA, as our SAS HBA was in use elsewhere. The Samsung SSD uses the U.2 2.5” form factor, which can run through the SerialCables HBA and JBOD enclosure. The Intel drive was directly installed in the PCIe slot. These drives were chosen as a spread of enterprise-grade devices that we had on hand. The Toshiba is an older, mid-range SAS drive, while the Samsung is a new, high-cost, high-capacity Gen4 NVMe drive. The Intel Optane drive is a different storage technology and makes an interesting comparison.
Our initial expectations were that the Toshiba SSD would fall well behind the other two due to its age and SAS protocol; SAS (Serial Attached SCSI) uses the SCSI command set, which was designed for spinning drives, whereas NVME (Non Volatile Memory Express) is designed for flash and should be more optimal. Connecting it to a motherboard SATA port would further limit its performance.
We expected the Samsung drive to use more power due to its high capacity and Gen4 speed, but we had no idea ‘how much more it would be. While our test PC is Gen3, we are using the SerialCables x16 Gen4 host card. In theory, the 16 lanes of Gen3 to the host card will be enough bandwidth to fill the 4 lanes of Gen4 on the host card on the SSD. The SSD does indeed link up and report that it is running at Gen4 speeds, but the overall performance may still be below that of a native Gen4 system.
Who will be the winner?
A comparison with several drives we had in our labs; fair testing was essential. We ran Quarch Compliance Suite, using the Power Vs Performance test suite (v1.0). Each drive started in an empty, formatted state.
The test script begins with a set of tests to measure the ‘best case’ write performance; it then runs a 200% write process to saturate the drive before running steady-state tests. Finally, we perform read tests. The only major difference is that the AIC card does not support hot-plug, so the hot-plug/power-up test is skipped for this device.
Results of interest
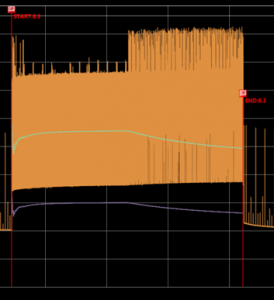
The first thing to note is just how different the performance traces look. The Intel drive looks very ‘clean’, with very predictable, steady power consumption.
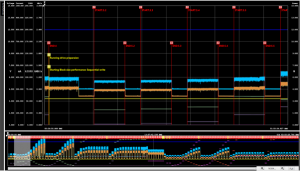
The Toshiba drive trace is a lot more cluttered, due to the greater variation in power consumption through the workloads. The Toshiba drive is oscillating between 3-6 watts while the Intel drive moves over a much smaller range: 5.3-5.6 watts for the same test.
The Samsung drive moves vary between 6.8-7.7 watts but peak up to 8.7 watts around once every 600mS in a regular pattern.
In QPS we can hide the voltage, current, and sidebands, and show just the total power and IO performance for a trace that is easier to view.
Example: Queue depth test
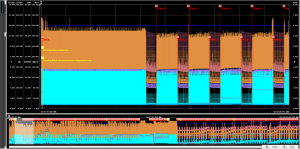
This example is a random write test, working through a range of queue depths, from 1 to 256. Each workload runs for 10 minutes, with a 5 minute idle before each it, to give the drive time to perform housekeeping tasks. Let’s look at all three drives during the QD=2 workload.
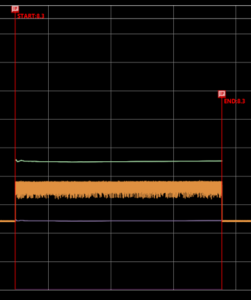
We can see the differences in performance stability. The Intel drive is almost completely flat across this workload (and almost every workload we tried)
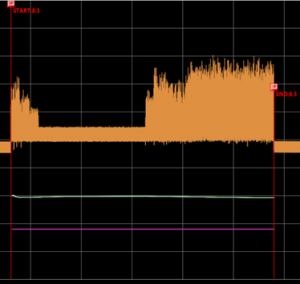
Toshiba changes significantly over time. There is a big dip then recovery in performance over the first 20 seconds, then a steady slow down after the 6-minute mark. Power use also increases at the same time.
The Samsung drive has much less of a performance dip, but the power consumption change is even more significant than on the Toshiba drive. The Samsung device shows this ‘double hump’ of power consumption across many of the initial workloads
Remaining tests
This is just a quick look at a couple of test points. The Power Vs Performance test has 18 sections, each of which looks at one specific workload type. The entire test takes several hours to run (over 24 hours in the case of the larger drives).
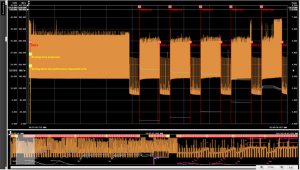
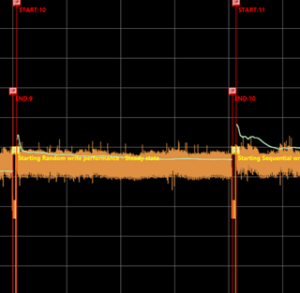
Each part of the test shows fascinating detail about the operation of the drive. For example, the Samsung drive performs quite differently after the 200% write pre-conditioning has been done.
After this, it has a far more steady power consumption:
Of course, these specific workloads may not pick up on some specific case you are interested in. The next version of QCS is coming with a custom power test, so you can select your own FIO job files to run!
PDF Report
Now let’s take a look at the PDF report output, which is generated at the end of the test
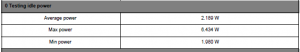
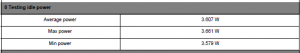
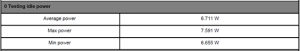
Idle power
The Optane drive uses more power at idle but has a lower peak consumption. The big Samsung drive uses greatly more power than the other two.
Toshiba SAS:
Intel Optane:
Samsung 8TB
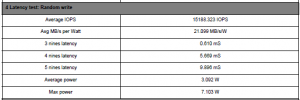
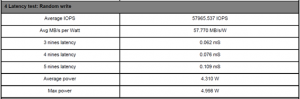
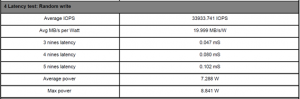
Latency
Unsurprisingly, the Optane drive has very good latency during random writes when compared to the older Toshiba drive. While it uses a bit more power, it is almost 3 times better in terms of power efficiency per MB written.
The newer Samsung drive is very interesting, though. Its latency figures match the Optane drive closely (though the actual throughput and power consumption are poorer). This may be due to our test system not being fast enough to get the best out of the Optane technology. It is also possible that the regular NVME driver is an issue. We later learned that Intel recommends the use of a custom driver for Optane products. One data point to note is that the Optane drive specification says it can manage 10uS latency, but we are only seeing around 75uS.
Toshiba SAS:
Intel Optane:
Samsung 8TB:
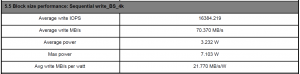
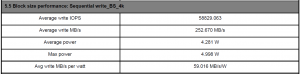
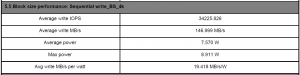
Write performance
Here’s one more example. A Sequential write test with a 4k block size. As we expected, the Optane drive is significantly faster. It also gets much better performance in terms of MB/s/watt (The amount of data written for the power consumed). Again though, it looks like the drives are being limited by our test PC and not achieving the full performance they could manage in a modern server.
The large Samsung SSD does draw the most power, both on average and at peak, as we expected.
Toshiba SAS:
Intel Optane:
Samsung 8TB:
Conclusions – Is your enterprise drive up to the challenge?

This was a fascinating process for us, being the first time we have been able to capture so much power and performance data with so little effort. The test runs did take a long time, especially for the Samsung 8TB SSD, but it needed no user intervention once the test was started and so could just be left overnight.
While many of the results were expected, the way that power consumption and performance can vary within a single workload is very interesting.
The use of the SerialCables Gen4 host card on a Gen3 motherboard seemed to work very well in our previous testing, where we used a single, heavily optimised FIO workload. The more detailed reporting we have turned on for this test seems to result in lower IO rates, so we need to look into the more complex options available in FIO. The lack of an Optane ready driver also needs to be investigated.
The good news is that if you do not like the FIO workloads we have chosen, you’ll soon be able to select your own! The next release of QCS is planned to have a custom Power Vs Performance test, where you can select one or more of your workload files to run. You can then benefit from our power measurement and reporting while using the exact workloads you want.

Andy Norrie