Andy Norrie
Testing your drive
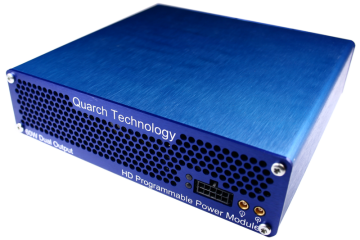
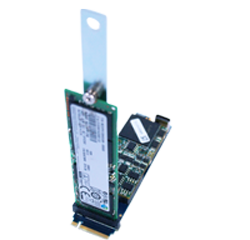
Test your SSD’s power versus performance by combining our innovative power analysis solutions with a workload generator. This allows you to monitor SSD performance across a wide range of scenarios. Allowing you to test your SSD’s power versus performance
We wanted to make this data easy to capture, so we combined FIO as a workload generator and Quarch Power Studio into a new test suite for the Quarch Compliance Suite (QCS). Now you can run a fully automated series of tests (many hours long) and report on a wide range of drive performance points.
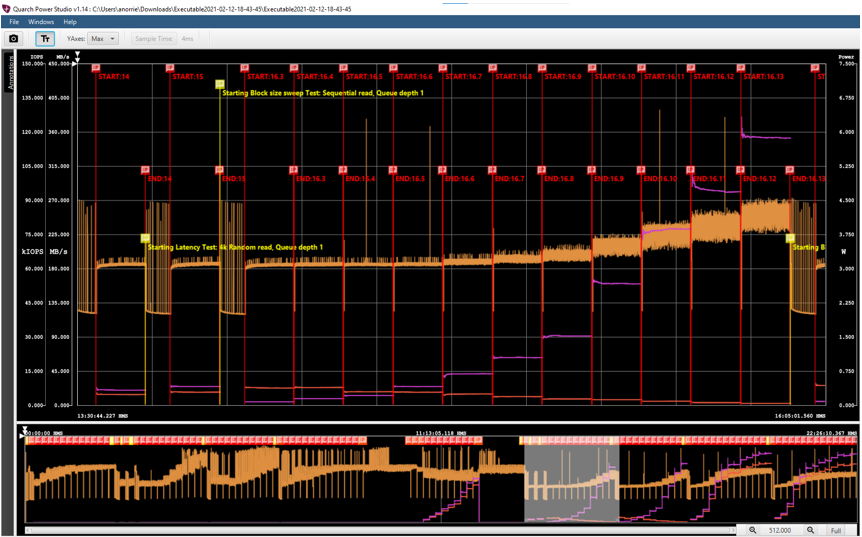
In the capture below, we see a small fraction of the trace with a block-size sweep. The power consumption (orange) increases slowly with block size, while the MB/s (purple) jumps up exponentially. This shows the drive is much more power-efficient and faster, with larger block sizes.
Power Vs Performance Test Suite
The version 1.0 test suite runs a wide variety of workloads. We sweep block-sized, queue depths and read/write percentages. We also compare best case and ‘steady state’ performance, by saturating the drive with writes for a long period of time. The current tests take 18+ hours to run (depending on the capacity of the drive). Finally, we can test idle power and peak inrush current.
The test cases are based on industry standards and best practices. Each test case is documented so that it could be run outside of QCS if you wish. Full details are available with the QCS download.
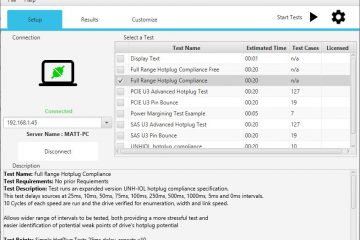
QCS is a licensed product, however, there are some useful free tests included, which are great to get you started.
Results
The power vs performance test has two major outputs:
QPS Trace File
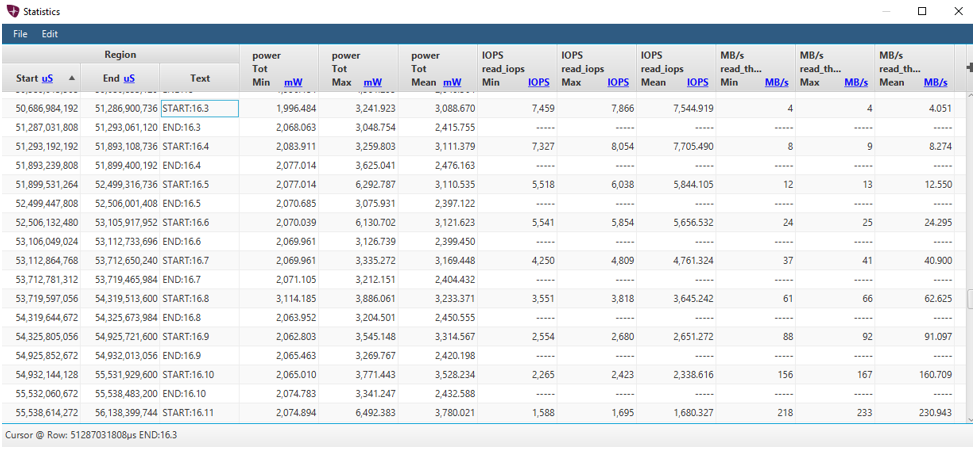
QPS saves the full trace file which can be opened and viewed later. This contains power and performance data for the entire run and is separated for each workload. You can zoom in, measure, screenshot and export raw data to CSV. You can also view detailed statistics for each workload, calculated automatically.
PDF Report
This report provides a detailed summary of the test. It documents the host and drives used, OS version, test time and similar.
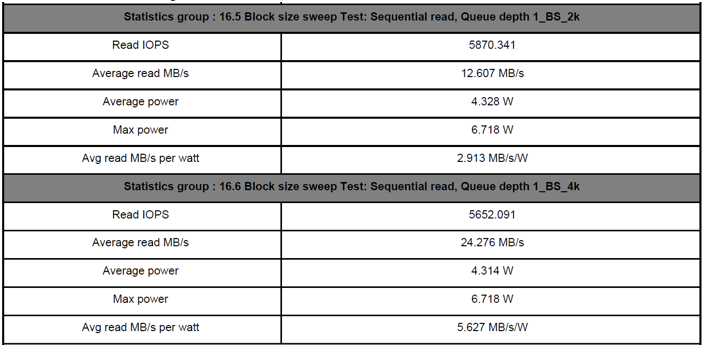
Each workload in the suite also has a table to document the main results. Below we can see the results for two different block sizes. Here, the 2k to 4k block size has a significant difference in MB/s, but almost no difference in power consumption.