Lee Hayashida
Where’s My Sleep State? Measuring NVMe SSD Low Power
Laptop manufacturers are in competition to provide a combination of the best performance and the best battery life, and as part of this requirement, the manufacturers must select consumer SSDs which advertise great performance and support low power states. Benchmarks for NVMe SSD read and write performance are fairly well understood, but what exactly are low power states and how can these states be measured?
With low power SATA devices, HIPM and DIPM (Host Initiated Link Power Management and Device Initiated link Power Management, respectively), if supported, allow the device to go to a low power state if a certain amount of idleness occurs. If the physical pin DEVSLP is supported, an even lower power state can be achieved.
NVMe SSDs have similar mechanisms, however, the SSD must support APST (autonomous power state transition) at the NVMe layer and ASPM (PCIe Active State Power Management) at the PCI Express layer. In order to achieve the lowest power state, a physical pin analogous to SATA’s DEVSLP pin is the PCI Express CLKREQ# pin.
Let’s examine a couple of case studies using a common platform, a common SSD but two different operating systems. The watermark that we are seeking is sub 10mW power consumption from an NVMe SSD and we can actually see this watermark achieved using either a Windows based or Linux based operating system. We will use Quarch’s Power Analysis Module (PAM), Quarch’s Programmable Power Module (PPM) and Quarch Power Studio (QPS) software. PAM not only measures power but also provides a useful scope representation of the SSD’s sideband signals, of importance here is CLKREQ#. The PPM acts as the actual power source for the DUT and can be used to perform voltage margining, slew rate ramping and rail noise injection.
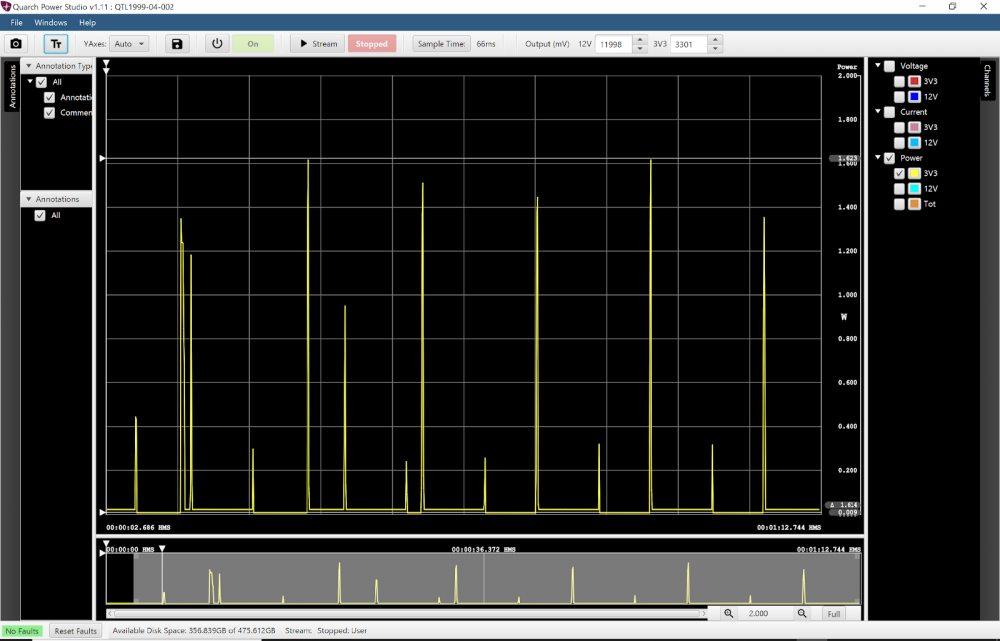
- Windows 10 and the steps to achieve this low watermark using the PPM tool.
Notice how frequently the OS appears to wake the SSD. The SSD is unable to reside in its lowest sleep state, L1.2, for extended periods of time.

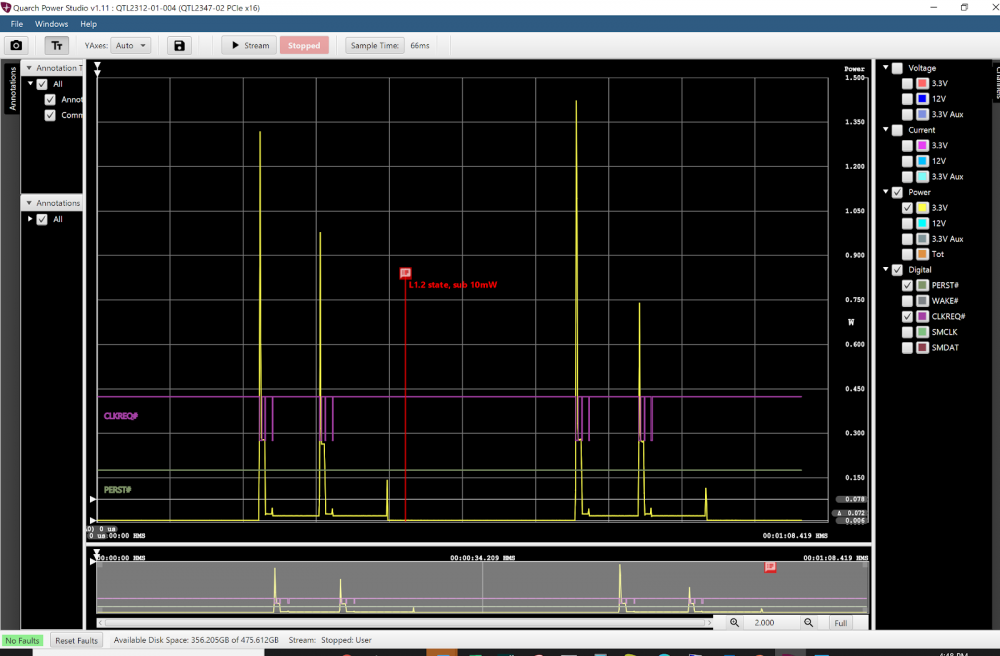
2. Linux (Ubuntu) and the steps to achieve this low watermark using the PAM tool.
PAM has the capability to also capture some of the sideband signals, such as CLKREQ#. You can see that the same SSD on the same laptop PC in the example above, is allowed to reside for longer periods of time in its deepest sleep state under Ubuntu.
We have shared two examples of an NVMe SSD’s ability to achieve the deepest level of sleep. A detailed explanation of the exact mechanisms of the NVMe and PCI Express software and hardware sleep transitions is best left in the capable hands of the SSD manufacturers. It was a surprise for us to see such a difference in the actual time that an SSD is allowed to reside in sleep between the two operating systems… Again, we defer to the industry experts to explain the differences.
What Quarch can deliver are tools that are easy to use, accurate, affordable, and practical for nearly every firmware or hardware engineer to have at their home office or lab bench at work. The compact footprint of either the PPM or PAM allows for collecting measurements in a confined space. With Quarch’s PAM or PPM, the user can determine if the advertised sleep state and power consumption have been achieved. It is up to the user to decide which tool is the best fit for the given job.
How to Optimize SSD Performance in Windows 10 or 11


