Stuart Boon
My dishwasher’s eco mode did NOT save energy!
Here at Quarch, we set out to answer the ultimate question about dishwasher energy consumption. How much energy do we save using Eco Wash? Fortunately, we had the perfect line of tools for the job. Unfortunately, the answer is not great!
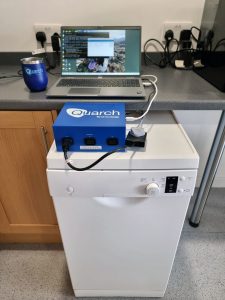 The ‘Eco’ mode on our dishwasher takes 3h 15min to complete, but the quick wash is only 29min. Both washes turn out sparkling, clean coffee cups for our thirsty engineers.
Being an energy-conscious lot, we’ve tended to run the dishwasher on Eco mode overnight and always felt a little guilty if we ran out of cups in the middle of the day and needed to use the quick wash.
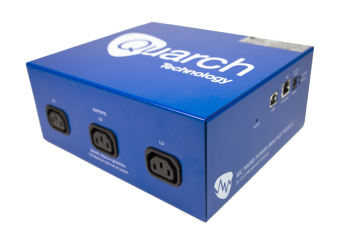
To settle the energy efficiency question, we took the Quarch AC Power Analysis Module (PAM) from its normal home in our engineering lab and plugged it in between the dishwasher and the mains power supply. It takes seconds to set up and can run via LAN or USB.
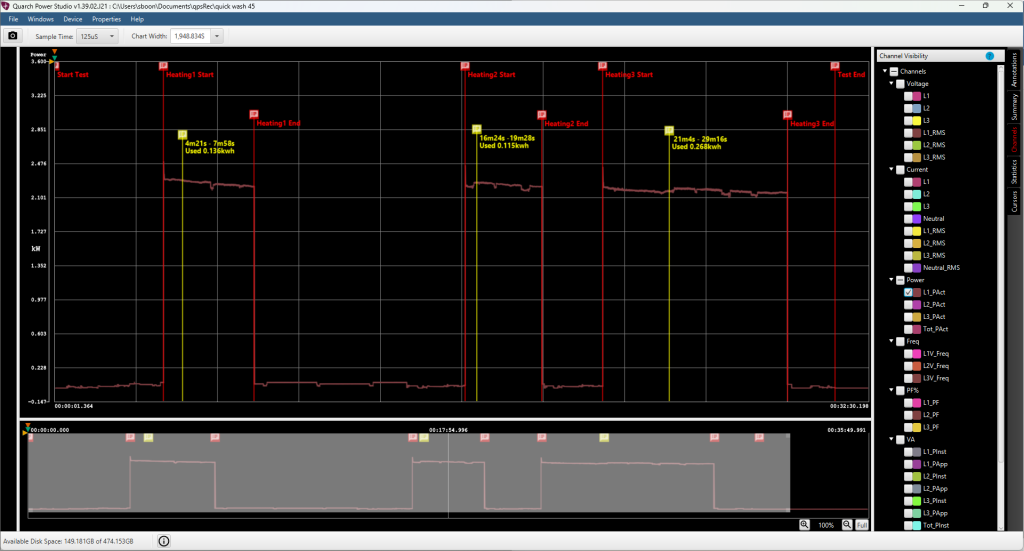
29 minutes later, the dishes are clean, and we have a full power trace. The quick wash is listed as running at 45C.
Below, I’ve annotated the main events in the trace (red markers) and added details of the power consumption for each of the 3 heating cycles (yellow markers) that use the vast majority of the energy. This data was grabbed from the statistics screen, that summarises data across the trace.
The total power consumption was 0.527192777 KWh. Yes that’s a lot of decimal places, but we are sampling 8000 times a second! Lets call is 0.527 KWh for the comparison.
Quick wash cycle
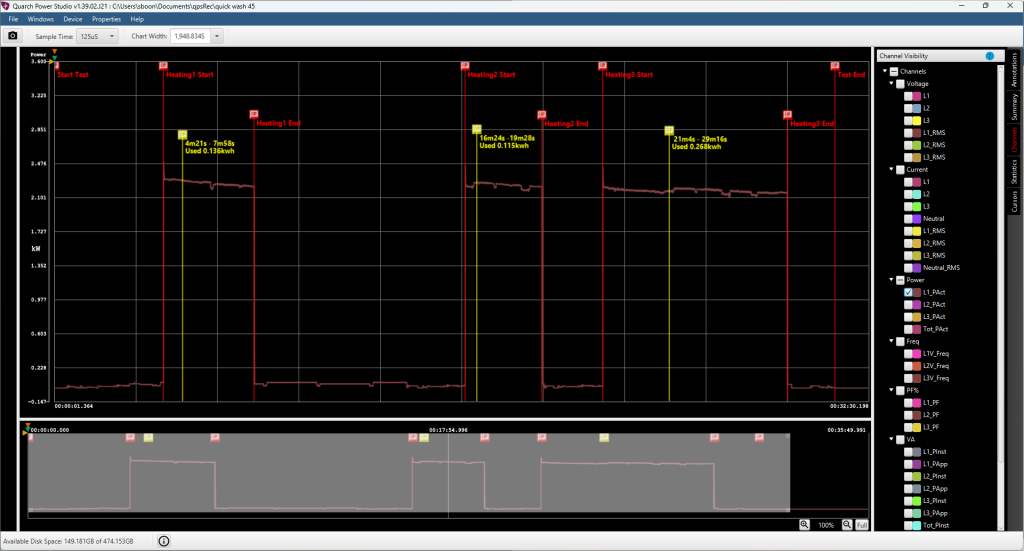
Next, we have the eco cycle. This takes 3 hours and 12 minutes and is listed as running at 50C. It is interesting that the ‘Eco’ mode has a higher temperature. I’d have expected the compromise to be a longer run at a lower temperature to save energy. Lets see what happens.
Eco-wash cycle
With both traces in, the results are clear, and its not looking good for Eco mode!
Quick wash: 29Min – 0.527 kWh
Eco Wash: 3h12min – 0.628 kWh
Intensive Wash: 2h20min – 0.803 kWh
Eco mode uses around 18% more power than the quick wash cycle. This dishwasher’s eco mode did NOT save energy! Now, I guess the manufacturer would argue that Eco uses more than the 3rd mode, ‘Intensive’, which runs at 70 °C, but I think its fair to say that the average user will select ‘Eco’ when they want to save energy.
Given this result, we will not be running Eco mode any more! Now this only applies to this specific dishwasher… perhaps yours is different? What’s clear, though, is that if you don’t measure, then you don’t know for sure.
Taking a deeper look
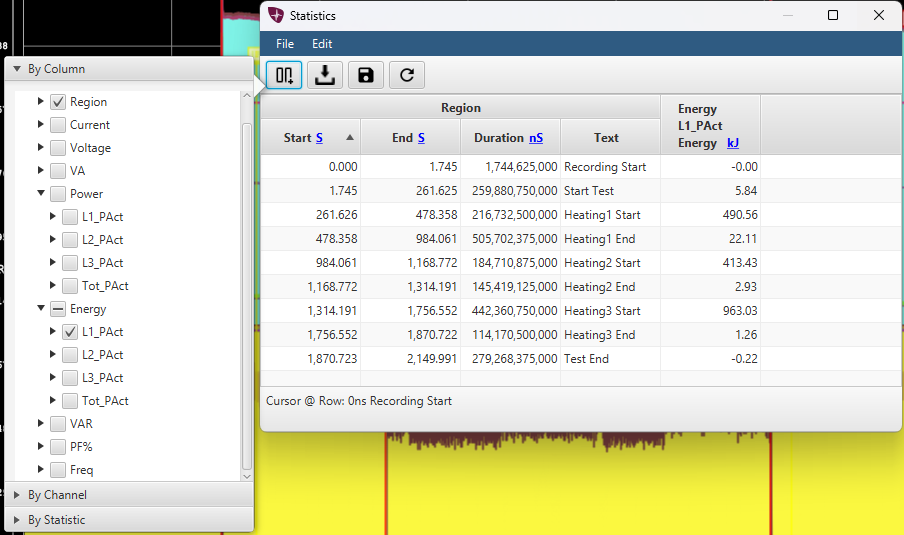
With the statistics system in QPS, we can calculate stats for min, max, mean, energy and more between pairs of annotations on the chart.
In these examples, we have placed annotations on the start and end of each heating section. Each cycle had 3 sections where the heater was running. Pulling them out, we can see the quick wash uses less energy to heat, giving it an immediate advantage.

The remainder of the difference comes from the longer wash cycle used during Eco mode, much of which has pumps running to circulate water.
These annotations were hand placed, but if we were doing this frequently, we would use auto-annotations or Python scripting to automate the whole capture process.
Here is an example of the stats, showing energy in KJ calculated from the phase 1 power channel.
What about water?
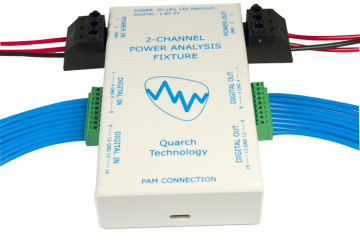
To be fair, the ‘Eco mode’ setting could be more about water saving. With a little hacking, we added a cheap flow rate sensor to the water inlet pipe. This hooked up to a digital input on a Quarch multi-channel PAM
Here is a peak at the data, the sensor produces 5120 pulses per litre of water, so we need to convert this into useful data

The CSV export mechanism of QPS (which can also be automated) gives me access to the raw data on the channel. This is 145 MB of nanosecond time-stamped data.

This is not ideal to work with, so a quick python script later and we can compress it down to 0.6MB, with one timestamp per pulse.
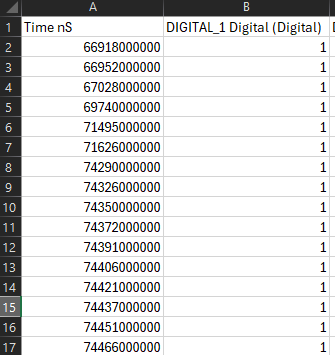
Now the data is reduced, we can process it quickly in another python function to output a new CSV containing rows for the total water use and ‘rate’ of water use per second.
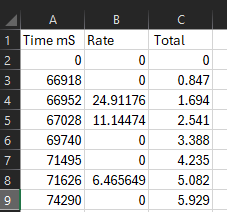
This data is perfect to add to QPS as a ‘custom user channel’ We can add the water data (or something else like temperature) right into the power analysis. This keeps all the data together and gives a much more interesting visualisation. Now this feature is designed for adding data during a live trace, but some quick work by the team got it working as a post-processing option (coming to a customer release soon!)
Here is the result, The light blue ‘flow rate’ and the dark blue total flow volume displayed against the power trace. Now there might be a small offset in time here, as this was a quick test and we did not sync the timestamps perfectly. Looking at the power trace, it appears to be ~12 seconds out, as we can see the power spike where the water valve is opened!
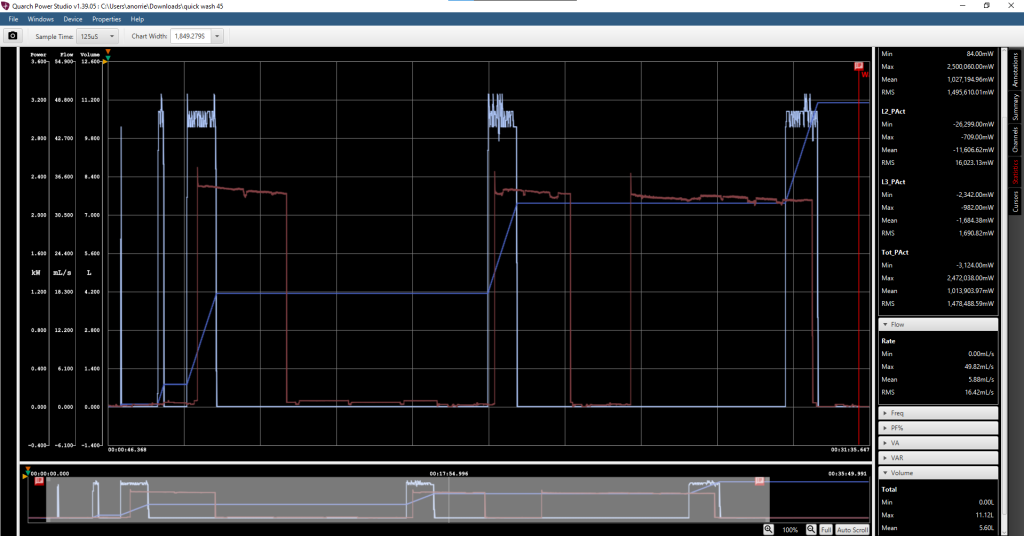
With the water results, we can expand our test results, but again, its not good for ‘Eco’ mode. It uses 43% more water that the quick wash!
Quick wash: 29Min – 0.527 kWh – 11.12 Litres
Eco Wash: 3h12min – 0.628 kWh – 15.98 Litres
Conclusion
Its clear that we cannot accept ‘eco’ claims from manufacturers. Independent testing is critical.
I hope this demonstrates that with just a few minutes of setup, you can be measuring power from consumer devices and getting interesting information to analyse.
It also shows that, with a little scripting, you can add additional data to get a better picture of the entire working cycle of a device.
We have a result from a single device, so if you want to choose one that is energy efficient, then you either need to analyse them, or go to someone who does: What are the most energy efficient dishwashers? – Which.co.uk
If you want to try out a Quarch product, contact us today:
Short term evaluation units are available for trial: Contact Us
Happy testing!

