How do you pass the OCP power measurement spec?
The OCP (Open Compute Platform) is rapidly expanding and a wider range of vendors are signing on. Are you working on an OCP NIC device for example, or an OCP SSD?
There are detailed power testing requirements that you must be aware of. The OCP 2.0 power measurement requirements have two key elements, and other specifications are already discussing similar language.![]()
Measurement Length
Devices must be measured continuously for a long period of time (15 minutes minimum). This ensures that a significant amount of data is captured, and sporadic changes in power use will not be missed.
Measurement Resolution
The measurement tool must be capable of sampling every 4uS and capturing every sample for the final result. This fast sampling rate captures ensures that all power spikes are fully captured

Max Average Power (MAP): PCM-1 Requirement
This measurement is intended to show the worst case consumption of the device. We take 15 minutes of power data, sampled at 2mS intervals or better. A 1 second average window is used, and the MAP result is the average power in the highest recorded window.
The 1-second window smooths out minor consumption spikes, providing a general overview of the device’s power usage under load. This figure can be used to look at total power load when many devices are running at once. It can also be used for energy efficiency calculations.
Device peak power: PCM-2 Requirement
This measurement looks at the smaller spikes we deliberately averaged out in the first test. We take 15 minutes of power data again, but at 4uS sampling to gain much more detail. We then use a much smaller 100uS averaging window. We would expect a significantly higher power result for this test, as we are interested in brief spikes (when writing data for example)
The result here can help is understand the maximum instantaneous load that the device can put on the system
Peak to average ratios: PCM-3 Requirement
A third requirement is given, which then requires us to compare the values captured above. Fortunately, no additional measurement is needed here, we just need to compare the limits based on the power of the SSD:
- For devices with a MAP of 25W or less, The Device peak power must not exceed 1.5x of the MAP value.
- For devices with a MAP between 25W and 29W, The Device peak power must not exceed 37.5W
- For devices with a MAP over 29W, The Device peak power must not exceed 1.3x of the MAP value.
How do I meet these requirements?
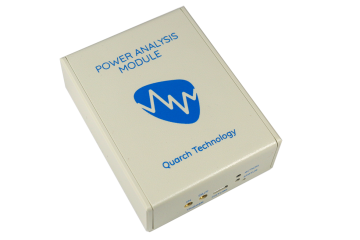
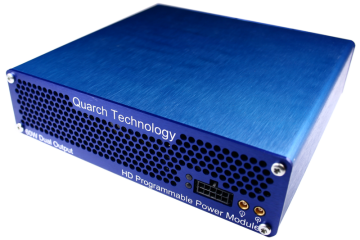
First, you need an accurate and calibrated measurement solution. Obviously, we would recommend the Quarch Programmable Power Modules or Power Analysis Module range
These tools both capture at 4uS sampling and can record for long periods of time. The OCP specification was originally written by engineers who had the Quarch tools as their reference power analysis product, so you know that you are following the industry leaders!
A good 2-channel scope and current probes or a high end power analyser will also meet the sampling and accuracy specs easily. There are additional challenges with these, though:
-
Quarch tools have plug-and-play fixturing for OCP devices. A scope will require you to get access for current clamps and voltage monitoring in place for both power rails. This is slow to set up and can be a source of errors.
-
15 minutes of data at 4uS is 225 Mega Samples (per channel). Many devices can samples this fast, but it will need a higher end one to hold the entire data set. Make sure you have enough memory on your scope!
-
Manual testing is fine for the first attempt, but automation is key for reliable and repeated tests. Quarch tools provide very simple automation to capture the full OCP data and results. Other tools may require a more complex set of steps to gather the data.
Anything that might trip me up?
- You need to use all the data
Every single 4uS sample in the 15 minute test must be captured and averaged to get the final result. You can’t have a fast sample rate, but poll the data at a lower rate
-
Others may be checking on you!
A number of storage companies run competitive analysis labs, many of them using Quarch tools. Its critical that you get your testing done right, and can defend your results in increasingly competitive market.
-
Windowing options
The OCP specification does not say what type of averaging window is needed. The two common options are overlapping or non-overlapping.
A 100uS overlapping window sampled every 4uS is shifted by 4 µs at each step and recalculated. A non-overlapping window is moved by 100uS each step and recalculated.
The difference in the result is unlikely to be significant, but there are two approaches that can be taken. Quarch provides every 4uS sample if desired, so you can run an overlapping window. (for the highest possible detail in your result).
If you use the built-in averaging functions in Quarch Power Studio (QPS) or our Python examples, then we default to a non-overlapping window, which is much less intensive to calculate.

Andy Norrie