
As Gen6 hardware is trickling into the world and getting into the hands of engineers, how will the change from NRZ signalling at Gen5 to PAM4 at Gen6 affect the errors within a link seen?
Like most manufacturers in the PCIe space, Gen6 hosts are currently unavailable for us to test with. We do, however, have a cable tester (QTL2250) that can count bit errors in cables. We can use this cable tester at a link up to 24G (~Gen4.5) to measure the link errors and a breaker to inject errors, and we can then make a prediction of how physical layer errors might affect the reliability of a link.
Bit Error Rate (BER) is the ratio of incorrect bits received divided by the number of bits sent. This has a target in the PCIe Gen5 spec of 1e-12, or 1 in a trillion bits, being incorrect. At Gen6, this changed to 1e-6, primarily because of the change to PAM4 encoding. First Bit Error Rate (FBER) is the probability of a first bit error occurring at the error. BER is approximately an order of magnitude worse than FBER The PCIe® 6.0 Specification Webinar Q&A: Error Detection and Correction with FEC | PCI-SIG.
How does PAM4 signal encoding impact PCIe 6.0 error rates?
A large part of the spec has been changed between Gen5 (32GT/s) and Gen6 (64GT/s), with arguably the most significant being the change from NRZ at Gen5 to PAM4 at Gen6, to double the bandwidth while still operating at 16GHz. PAM4 brings 4 voltage levels instead of 2, which reduces the amplitude available for each voltage level.
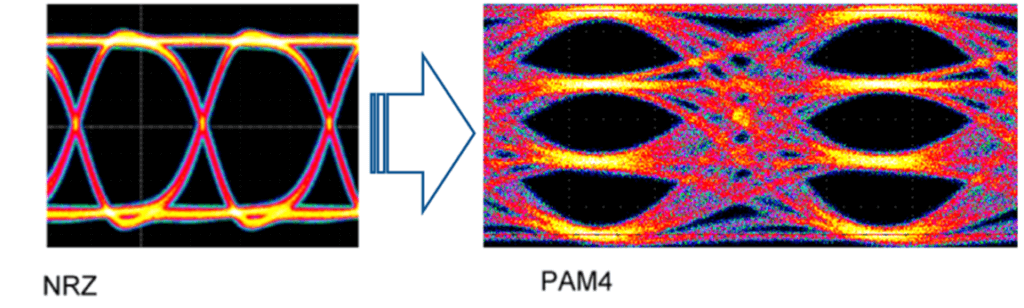
What Is PAM4? Understanding NRZ and PAM4 Signaling – The Samtec Blog
This means that Gen6 is much more sensitive to noise and burst errors, and there would be significantly more errors in a Gen6 link than an equivalent Gen5 link. To mitigate the increased BER PAM4 brings, Forward Error Correction (FEC) has been introduced to correct detectable errors before they even reach the receiver.
FEC is designed to be low latency, so Gen6 moves to fixed-size packets (FLIT) instead of the variable-size TLP packets previously used, so the FEC is able to be lightweight and work on predictable packet size. Cyclic Redundancy Check (CRC) is the other part of error correction, targeting errors that are missed or unable to be corrected by FEC, which works by retrying the packet. FEC is designed to have very minimal latency, so it cannot catch all errors, but it is backed up by very fast link-level replay to correct errors it can’t.
FEC can only correct errors that it can both detect and correct. FEC should bring down the effective BER to well below 1e-6 target at Gen6, but still at a higher level than the Gen5 and previous generations’ target of 1e-12. The PCIe® 6.0 Specification Webinar Q&A: Error Detection and Correction with FEC | PCI-SIG.
The jump to Gen6 required changes in how we handle link reliability, with error-related metrics being loosened, including FBER changing from 1e-12 at Gen5 to 1e-6 at Gen6, with packet retry probabilities increasing from 1e-9 to 1e-6. The Evolution of the PCI Express Specification: On its Sixth Generation, Third Decade and Still Going Strong | PCI-SIG.
| PCIe Gen5 | PCIe Gen6 | |
|---|---|---|
| Data Rate | 32GT/s | 64GT/s |
| Signalling | NRZ (2 voltage levels) | PAM4 (4 voltage levels) |
| FBER Target | 1e-12 | 1e-6 (Pre FEC) |
| Packet Structure | TLP (Variable size) | FLIT (Fixed size) |
| Error Correction | CRC + Retries | FEC + CRC + Retries |
Measuring bit error rates (BER) with cable testing & error injection? Script & test process
We are using Application-Notes/Application_Notes/AN-036_Injecting_And_Counting_Errors at main · QuarchTechnologyLtd/Application-Notes to measure the errors for this test. This uses a cable tester to measure the errors and a breaker to inject glitches. We start by glitching a single lane at 100 ns, then increase the glitches to 10x longer to 1 ms. From each longer glitch, we’d expect the error rate to increase 10x. We also glitch multiple lanes and expect a glitch across 2 lanes to be approximately double a single lane. Our first check is to ensure that the error counts increase as we expect them to, so we can store the measured error counts in a CSV, which is used in another script to plot the measured data and predict 32G and 64G.
Estimating the errors at different link speeds is hard. Insertion loss and crosstalk are nonlinear, so we would expect the errors at 16G to be about double the errors at 8G. For our predictions, we are using exponential extrapolation. We start by comparing the measured data that we have to check that the error counts increase as we might expect them to.
This allows us to build a fairly comprehensive picture of the trends of glitching, so using the measured data we have, we can get a reasonable estimate of the error count at Gen5 and a wider estimate of the errors at Gen6.
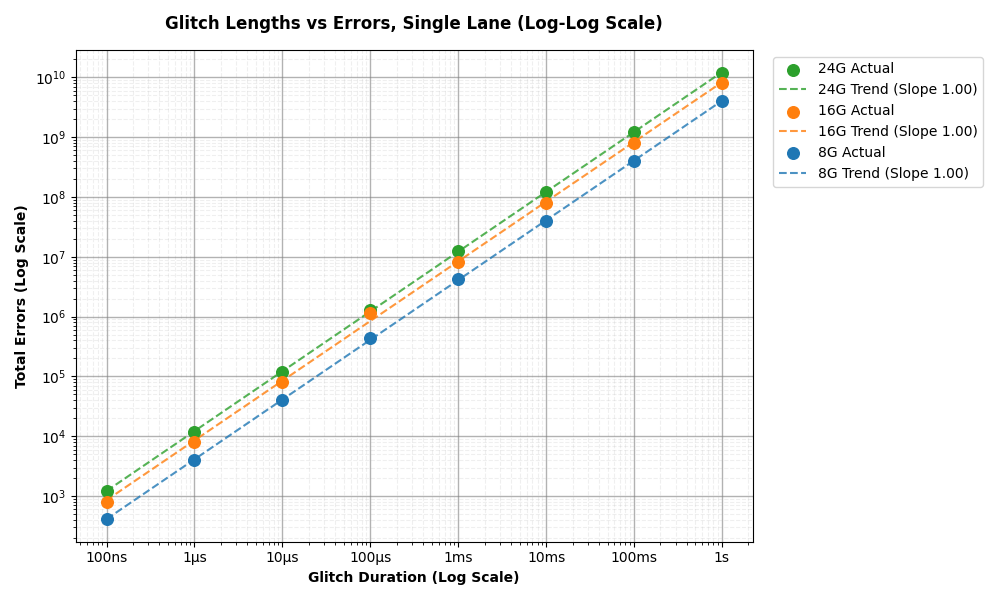
Firstly, we want to check that our errors increase how we expect them to before we make a prediction from our measured counts. Looking at the single lane errors shown in Figure 1, we can see the trend of error counts increasing approximately 10x when we increase the glitch length by 10x—this is what we expect. We can also see that the errors from a 16G glitch are approximately double that of an 8G glitch and that the errors from a 24G glitch are approximately 1.5x those of a 16G glitch. This is good, as we can see errors are increasing predictably, so we can make a reasonable estimate.
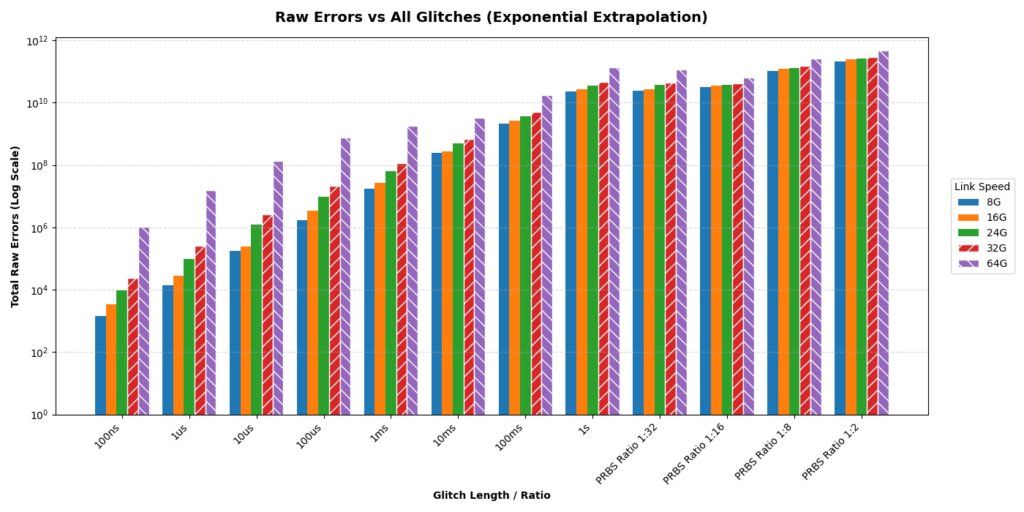
Figure 2 shows the raw error counts of lane widths combined. Again, we can see the increase of errors in both generation and in glitch length.
We also measured the impact of PRBS (Pseudo-Random Binary Sequence) glitches. Using a 1:32 ratio, the signals are glitched for 3.125% of the time in a pseudorandom pattern. These PRBS tests span 10 seconds, which explains the massive error counts. Interestingly, a 1:16 ratio does not perfectly double the errors of a 1:32 ratio, likely reflecting the unpredictable nature of intermittent, real-world burst errors compared to fixed-duration physical drops.
Perhaps the most useful plot is the Bit Error Rate (BER) shown in Figure 3. A lower BER is better, meaning that we have fewer incorrect bits received compared to the bits transmitted. This plot combines the results for 1 lane, 2 lanes, and 4 lanes being glitched. The BER calculated here uses the formula, with test_length being approximately 15 seconds for each test.

For reference, the Gen5 BER (1e-12) is shown in the dotted red line, so all glitches at all link speeds measured would breach this target. At Gen6, theoretically, a glitch of up to 100 ns would still meet the FBER target of 1e-6 but is likely to overwhelm FEC. In a real Gen6 system, this is likely where CRC will kick in and resend the packet.
Predicted physical layer error impact on PCIe Gen6 links
What do these plots show? As we might expect, longer glitches have a higher BER, and for the same glitch length at a faster bit rate, we can also see BER increase. We can see the BER increase at Gen6, when compared to Gen5, by a quite significant margin. This is unexpected from our predictions but could be close to reality in a real Gen6 system. At Gen6, even a 100 ns glitch obstructs a vast amount of data from being received correctly. We may well see the FEC of a system be overwhelmed, and the link-level retry rate be significantly higher.
There are a few reasons why our predictions might be an overestimate and also an underestimate. Our method of predicting the Gen5 and Gen6 errors was exponential extrapolation, which, using 3 data points, means we are likely to overestimate the errors. However, the cable tester uses NRZ signalling, so our Gen6 prediction is based on using NRZ at 32 GHz rather than PAM4 at 16 GHz. This likely means we are underestimating our errors, as PAM4 is much more sensitive to noise and burst errors. We also aren’t transmitting real data in a real system with more loss and more noise, which could be another underestimating factor.
When balancing these factors, we might see the true BER and error counts be about what we predicted. Until Gen6 hosts are widely available to create a full Gen6 system, we can only predict what errors we might see in a Gen6 link. You could use AN-036 to recreate this experiment with your own cable tester to make your own predictions; you can predict the impact of FEC on your system, or you could use AN-036 as a starting point for your own automated cable tester scripts.
FAQ
What is the difference between PCIe Gen5 and Gen6 error correction?
Gen5 uses NRZ signalling with a higher tolerance for noise, so Cyclic Redundancy Check is typically enough to keep error rates within the specification. When an error is detected by the receiver, there is a retry, and the sender resends the packet.
Gen6 uses PAM4, which is much more sensitive to noise, so Forward Error Correction is introduced to correct errors before they reach the receiver, but if this is overwhelmed, then CRC and link-level retries are used as they were in Gen5 to resend the packet.
Ready to start testing? We have a wide range of Gen6 products available for purchase today, covering different form factors and different numbers of lanes switched. Contact your local reseller.
Find out about Quarch Resellers and International Partners or contact support@quarch.com for quoting, advice, and support.

Andrew Steedman